STATS DROP: Round 22, 2023
Hoodoos, Hoodoo Gurus, ends of the Universe, Form Elo, Pythagorean expectation, 2nd order wins, WARG and TPR for NRL and Queensland Cup
Welcome to Stats Drop, a weekly inundation of rugby league numbers.
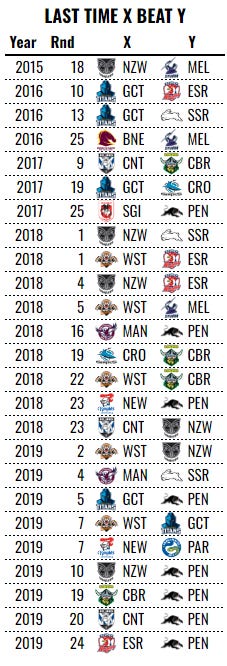
A very simple Stats Drop this week: what are the longest streaks - hoodoos, if you will -in the NRL?
I removed the Dolphins and defunct clubs from consideration for fairly obvious reasons. Still, congratulations to the Adelaide Rams, who haven’t been beaten by Penrith since round 4 of the 1998 season.
The only team to not beat the Broncos since covid are the Bulldogs, which probably says a lot about that program. The Tigers are in the same spot with respect to the Titans. The longest Cowboys-based hoodoo is the Raiders, who haven’t beaten North Queensland since round 12, 2020. It’s probably worth remembering that the Broncos, Titans and Cowboys have all been pretty bad at points in the last four seasons.
Of the 25 longest droughts, the Tigers have five and the Warriors and Titans have four each. The Broncos have one; no prizes for guessing whomst. The Cowboys have somehow beaten everyone - the Sharks in last year’s qualifying final being the last monkey to be removed from the back - since losing to the Broncos towards the end of last year. Except, that is, for the Dolphins.
Eight teams, nearly half the league (and nine if you include the Dolphins), haven’t beaten Penrith since their rise to the top of the Vlandoball era, seven of which are in the top 25 longest droughts. The Raiders, Rabbitohs, Roosters and Storm have three appearances each in that list.
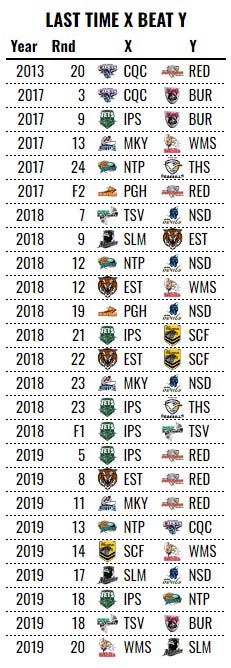
Here’s the Queensland Cup equivalent list
It’s not surprising to see Redcliffe, Burleigh and Norths make up a large proportion of the right hand column or Ipswich in the left hand column (refer JETS WATCH).
Shout out to the Capras, who have the longest hoodoo against the Dolphins - it’s been a decade now - but also somehow haven’t lost to the Pride since 2019 (this is because 2020 was cancelled, they didn’t play in 2021 and then the Capras got good).
Trivia
JETS WATCH: Still winless. There are so few games left that Elo is no longer forecasting any wins.
Following their loss to the Warriors in round 14, the Dolphins’ hoodoo against Auckland dates back to the 1976 AMCO Cup.
I think the Hoodoo Gurus’ “What’s My Team?” promotional campaign might be the only one I actually have any recollection of seeing. Too young for Tina, too old for pretty much anything after the Gurus. It doesn’t help that I no longer have a lot of clear memories of being a kid. There’s too much trivia in the way.
The Tigers lost 74-0 to the Cowboys in round 18 and somehow the Bulldogs’ points difference is still worse (-213 and -261). If you were able to replace that loss with a nil-all draw, that would bring the Tigers’ points difference in line with the next worst in the NRL, the Dragons’ -139.
The Bulldogs are currently losing by an average of 13.1 points per game. If continued to the end of the season, this would only be the 14th worst mark in NRL history. Last year’s Tigers lost by 13.5 points and the year before’s Bulldogs lost by 15.4. So while the 2023 versions are very bad, they have actually been worse in recent memory but not necessarily at the same time.
The Panthers are winning at an average of 13.5 points per game, which is actually lower than both 2021 and 2020. It would be the ninth best rate, if continued through to round 27, in NRL history. Only above them in the list are Brisbane (1998), Parramatta (2001), Sydney (2004), Melbourne (2007, 2019, 2021) and Penrith. The gap to the next best team, the Broncos is 5.9 points per game. Comparable gaps between the best and next best happened in 2000 (BNE 11.8, NEW 5.9), 2001 (PAR 16.7, BNE 7.1), 2007 (MEL 14.6, MAN 9.2) and 2017 (MEL 12.4, BNE 6.8).
NRL Stats Drop
Scroll to the end for the explanatory notes or visit How It All Works.
Queensland Cup Stats Drop
Explanatory notes
Elo Ratings
Elo ratings are a way of quantitatively assessing teams, developing predictions for the outcomes of games and then re-rating teams based on their performance, home ground advantage and the strength of their opposition. Form Elo ratings are optimised for head-to-head tipping and tend to reflect the relative strengths of each team at that particular point in time, although there are many factors that affect a team’s rating.
Pythagorean Expectation and Winning Percentage Comparison
The black dots on the winning percentage comparison are each team’s actual win-loss record to this point in the season. The coloured dots represent what the stats say about the team’s underlying performance, i.e. how many games they should be winning. Wins and losses are binary and can be prone to good and bad luck in a way that other stats that correlate to wins are not, so we have other metrics to help see through the noise to good teams, rather than just good results. While each metric has strengths and weaknesses, it helps paint a more complete picture of team performance.
Pythagorean expectation (gold) relies on points scored and conceded by estimating a team’s number of wins based on their for and against. Where there is a deviation between a team’s actual record and their Pythagorean expectation, we can ascribe that to good fortune, when a team wins more than they are expected to, or bad fortune, when a team wins less than they are expected to. 2nd order wins (silver) relies on metres and breaks gained and conceded. Elo ratings (maroon) rely on the margin of victory and strength of opponent.
Dots should tend to gravitate towards each other. If a team’s dots are close together, that means their actual results are closely in line with their underlying metrics and represents a “true” or “fair” depiction of how good the team is. If a team’s coloured dots are clustered away from their actual record, then we should expect the actual and the coloured cluster to move towards each other over time.
If the black dot is well above gold, that team is suffering from good fortune and may mean regress to more typical luck in the future (vice versa also holds). The silver dots will tend to hover around .500, so if gold is between silver and .500, the team could have an efficiency issue. On the balance, I would expect more often the actual percentage will move towards the cluster but the opposite is also possible.
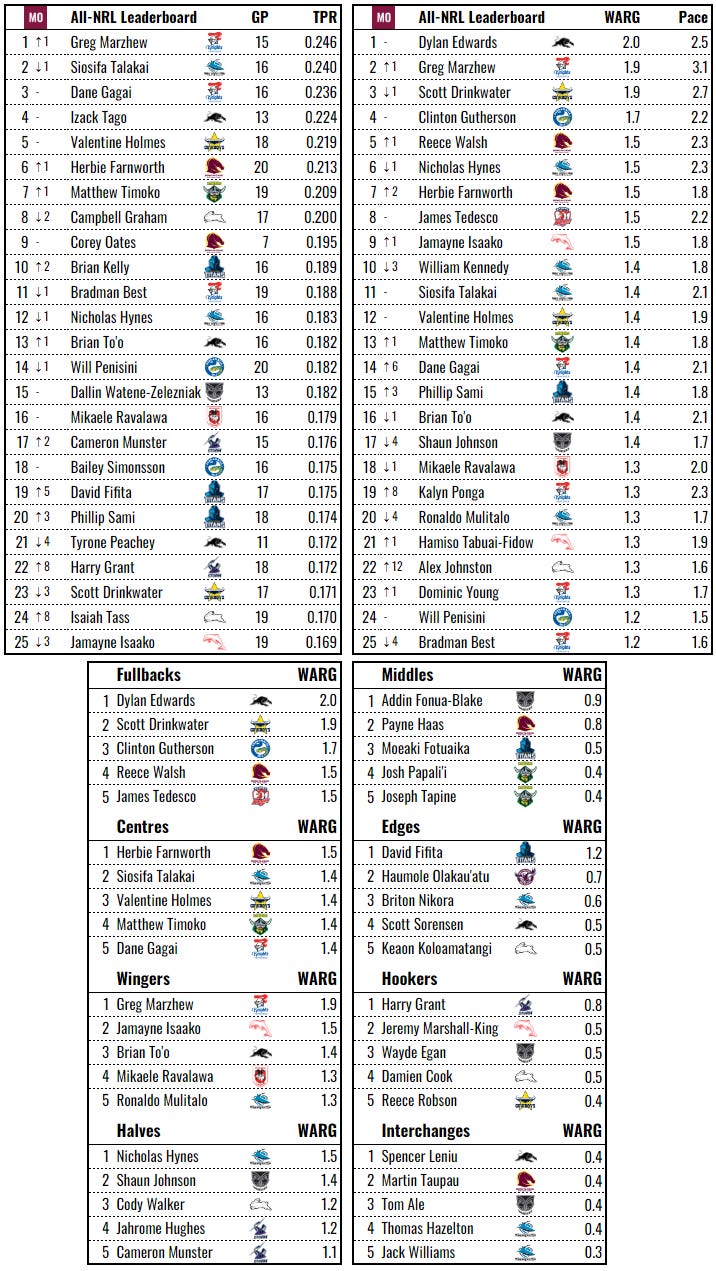
Player Leaderboards
Production the amount of valuable work done by a team as measured in counting statistics that correlate with winning. These statistics are converted to a single unit called Taylors. Taylor Player Ratings (TPR) are a rate metric that compares an individual player’s production, time-adjusted, to that of the average player at their position, with a rating of .100 being average (minimum 5 games played). Wins Above Reserve Grade (WARG) is a volume metric that converts player’s production over a nominal replacement level into an equivalent number of wins they contribute to their team.
Team Strengths
A chart that tabulates each team’s WARG, both as a team total and broken down into platoons by listed position, to identify each team’s relative strengths and weaknesses.
The WARG is the sum produced at the position, not by specific players, e.g. if Kalyn Ponga produces a total of 1.5 WARG comprising 1.0 WARG while named at fullback and 0.5 WARG named at five-eighth, then the WARG produced while named at fullback will be added to the 1-5 platoon and the WARG created while named in the halves will be added to the 6+7+9 platoon.
The top team in each category is rated 100, the bottom team is rated 0 and every team in between is scaled accordingly.
Team Efficiencies
This table compares the SCWP produced and conceded by each team (a product of their metres and breaks gained and conceded) against the actual points the team scores and concedes to measure which teams are most efficiently taking advantage of their opportunities. A lack of efficiency here could be the result of bad luck and poor execution - sometimes you have to watch the games.
Thanks for reading The Maroon Observer. If you haven’t already, you can subscribe below to receive all the latest about Queensland rugby league.
If you really enjoyed this, please forward the email on to someone who might also enjoy it.


