STATS DROP: Round 9, 2023
Cowboys' woes analysed, Verona Rupes, Form Elo, Pythagorean expectation, 2nd order wins, WARG and TPR
Welcome to Stats Drop, a weekly inundation of rugby league numbers.
The Cowboys were a very bad team in 2021 (7-17, -288). Over the off-season, North Queensland made a handful of signings and became a very good team in 2022 (17-7 +272). In 2023, sitting second last after nine rounds, it seems the Cowboys are very bad again (3-6, -68).
It wasn’t really clear how the signature of Chadwick Townsend turned the Cowboys around to the tune of ten wins but people were happy to roll with it. The season ended on a sour note in a home preliminary final but overall, it was a huge improvement, promising an exciting future for North Queensland.
Pre-season, I thought 2022’s improvement seemed sustainable, that the Sharks were the frauds of the two, that the pieces of the Payten system had finally clicked into place, and that North Queensland might come back to the pack by a few wins but could still challenge. Instead, it looks like the Cowboys will miss the finals.
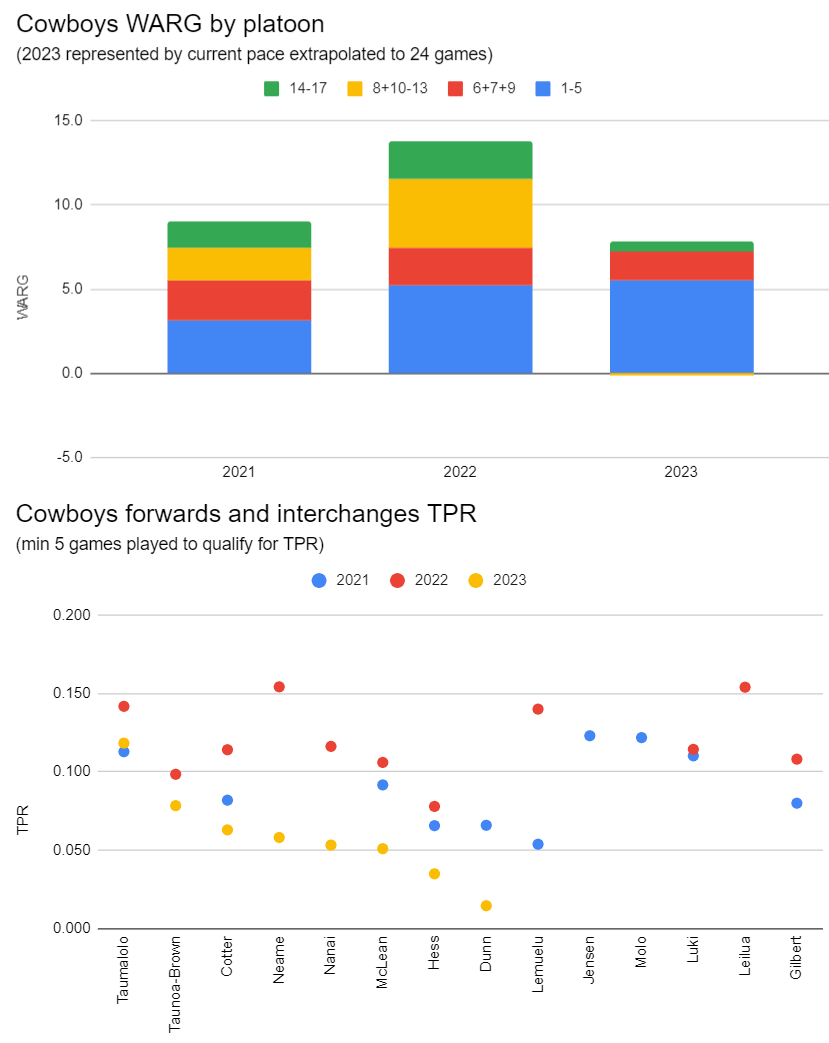
As the next two charts show, it’s not going to be too hard to work out where the problem lies.
Production, TPR and WARG aren’t everything, and they don’t measure defensive capability well, but the metrics do correlate with winning. In any case, the Cowboys were one of the more defensively efficient teams (for the amount of opposition attack they face, they let in comparatively few points), until they shipped 44 to Cronulla, and are now rated at the tail end of the midfield, just under average.
The backs seem to be holding up their end of the production bargain - more on that later - but right now, there’s a huge gaping hole where their pack used to be. Forwards around the league are having a tough time putting up numbers in 2023 but the Cowboys’ starting pack ranks dead last in the league in WARG and the bench isn’t much better.
North Queensland are spotting their opposition about 80 metres on average, with the ninth most metres gained and the seventh most metres conceded, so the lack of production isn’t necessarily raw metres. The Cowboys are 14th for post-contact metres, are second for penalties conceded and lead the league in missed tackles, giving up nearly two more per game than any other side.
Nanai and Neame, in particular, have not just gone off any cliff, they’ve gone off Verona Rupes. Whether Nanai is reverting to his long term capability after a break out year (Boom Rookies compared 22 Nanai to 17 Hess, which is looking increasingly apt), or is carrying an injury, or has something else going on in his life, or some combination of, remains to be seen. Dropping Nanai or others isn’t going to help as the Blackhawks aren’t travelling much better (third last, 2-4 and -27), which suggests reserve grade reinforcements are not available or unlikely to be any more effective.
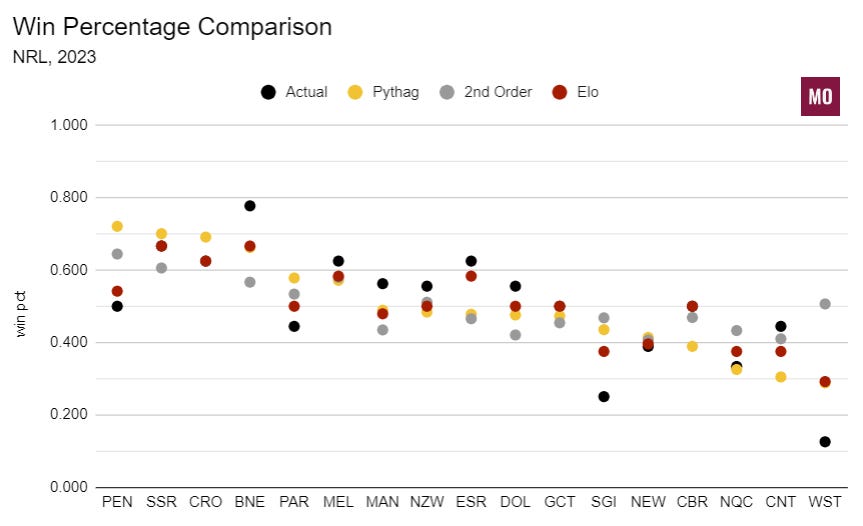
The Cowboys will probably get a bit better than they are, although their Pythagorean expectation and 2nd order wins are sliding closer to their reality, rather than the other way around. They should have beaten the Dolphins and the Warriors and could have beaten the Dogs, but didn’t. Fans would be hoping the performance against the Sharks was an aberration and not a sign of things to come.
Even if Payten can get the pack producing, a task made more difficult Taumalolo and Nanai sidelined for a while, the next, slightly less pressing problem is that the offence is still horribly inefficient. For the metres and breaks the Cowboys make, they are one of the worst in the league at converting those in to real points. Only the Tigers have been worse and watching any Cowboys red zone set will confirm this. The Cowboys woes are not just those of the forwards, something that’s concealed in earlier graphs by Valentine Holmes’ excessive production to start the year, which is itself probably an attempt to shoulder the burden and make up some of the difference.
While Payten has enough capital to ride out another bad year, if we extrapolate this level of performance to this time next year, he won’t be around for Magic Round 2024. He needs to find solutions and quick.
Trivia
As measured by WARG, Valentine Holmes is having his best start to a season. He has currently accumulated 0.68. His previous best marks through nine rounds were 0.50 in 2021, 0.37 in 2017 and 0.35 in 2022.
There are four Queensland Cup players with more than 8 WARG accumulated between 2016 and 2022 (the extent of data I have) - Jonathon Reuben (8.8 for Blackhawks, Falcons, Dolphins and Devils), Sami Sauiluma (8.7 for Bears), Jack Ahearn (8.5 for Devils and Dolphins) and Sam Scarlett (8.4 for Magpies and Wynnum).
Verona Rupes on Uranus' moon of Miranda is the highest known cliff face in the solar system. Estimated at 20 kilometres in height, it would take 12 minutes to fall from top to bottom, reaching a maximum speed of 200km/h, under the force of Miranda's gravity, which is seven thousandths that of Earth's.
Form Elo Ratings
Elo ratings are a way of quantitatively assessing teams, developing predictions for the outcomes of games and then re-rating teams based on their performance, home ground advantage and the strength of their opposition. Form Elo ratings are optimised for head-to-head tipping and tend to reflect the relative strengths of each team at that particular point in time, although there are many factors that affect a team’s rating.
Pythagorean Expectation
Pythagorean expectation estimates a team’s number of wins based on their for and against with a reasonable degree of accuracy. Where there is a deviation between a team’s actual record and their Pythagorean expectation, we can ascribe that to good fortune, when a team wins more than they are expected to, or bad fortune, when a team wins less than they are expected to.
There’s always one or two teams each year that win more than their Pythagorean expectation and one or two that grossly underperform and it’s difficult to tell in advance which is which, but over the long run, Pythagoras remains undefeated and always demands his tribute.
Win Percentage Comparison
The black dots are each team’s actual win-loss record to this point in the season. The coloured dots represent what the stats say about your team’s underlying performance, i.e. how many games they should be winning. Wins and losses are binary and can be prone to good and bad luck in a way that other stats that correlate to wins are not, so we have other metrics to help see through the noise to good teams, rather than just good results.
Pythagorean expectation (gold) relies on points scored and conceded. 2nd order wins (silver) relies on metres and breaks gained and conceded. Elo ratings (maroon) rely on the margin of victory and strength of opponent. Each metric has strengths and weaknesses.
Dots should tend to gravitate towards each other. If a team’s dots are close together, that means their actual results are closely in line with their underlying metrics and represents a “true” or “fair” depiction of how good the team is. If a team’s coloured dots are clustered away from their actual record, then we should expect the actual and the coloured cluster to move towards each other over time.
If the black dot is well above gold, that team is suffering from good fortune and may mean regress to more typical luck in the future (vice versa also holds). The silver dots will tend to hover around .500, so if gold is between silver and .500, the team could have an efficiency issue. On the balance, I would expect it’s more the actual moving towards the cluster but the opposite is also possible.
Team Efficiency
This table compares the SCWP produced and conceded by each team (a product their metres and breaks gained and conceded) against the actual points the team scores and concedes to measure which teams are most efficiently taking advantage of their opportunities. A lack of efficiency here could be the result of bad luck and poor execution - sometimes you have to watch the games.
Player Leaderboards
Correction: Found more irritating and embarrassing and exhausting errors in the depths. I’ve been sufficiently punished by having to repeat a ton of very boring work.
Production the amount of valuable work done by a team as measured in counting statistics that correlate with winning. These statistics are converted to a single unit called Taylors. Taylor Player Ratings (TPR) are a rate metric that compares an individual player’s production, time-adjusted, to that of the average player at their position, with a rating of .100 being average (minimum 5 games played). Wins Above Reserve Grade (WARG) is a volume metric that converts player’s production over a nominal replacement level into an equivalent number of wins they contribute to their team.
Queensland In Focus
Thanks for reading The Maroon Observer. If you haven’t already, you can subscribe below to receive all the latest about Queensland rugby league.
If you really enjoyed this, please share it or forward it on to someone who might also enjoy it.


