STATS DROP: Origin 1 and Round 12, 2023
State of Origin squads, Interstate Series attendances, Project Genetrix, Form Elo, Pythagorean expectation, 2nd order wins, WARG and TPR for NRL and Queensland Cup
Welcome to Stats Drop, a weekly inundation of rugby league numbers.
Lineups for the first game of the men’s Origin series were announced yesterday, largely confirming the Newscorp leaks of the days prior.
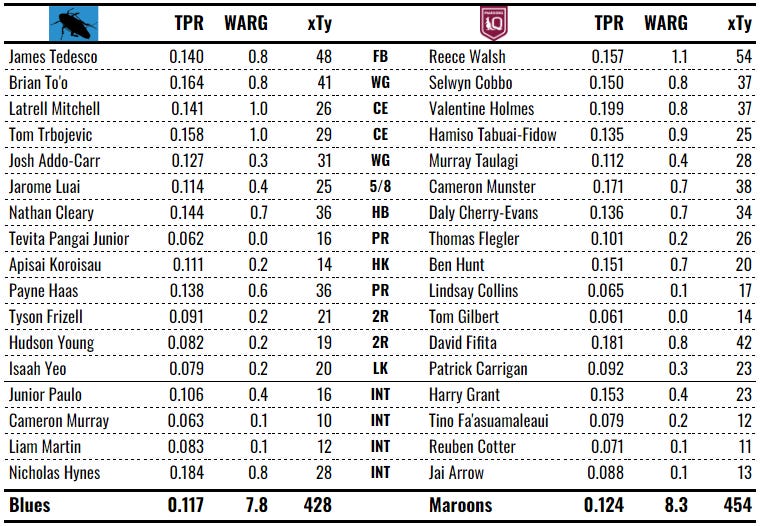
Here’s how the sides stack up using each player’s season to date Taylor Player Rating (TPR), Wins Above Reserve Grade (WARG) and the expected Taylors (xTy) each player is predicted to produce.
Before we get too far into the analysis, it’s worth pointing out that this form of Taylor-based analysis is fine for the NRL but it has been extremely bad at predicting the actual outcome of State of Origin matches.
Since 2014, with the exception of two games, NSW has always been favoured, typically by 5% to 10% winning percentage (or a margin of about three to five points). In that time, the Blues lost five of nine series, including losing 14 of 27 games, albeit out-scoring the Maroons 508 to 4271. Perhaps the Taylors just need a 5% adjustment due to the Maroons just getting Origin?
Even the two games in which Queensland were favoured (game 2, 2016 and game 3, 2017), it was by a combined total of nine (9) Taylors, or about as slim a margin as is possible to estimate. In 2023, Queensland have a clear, and unprecedented, advantage in lineups based on their component players’ expected production.
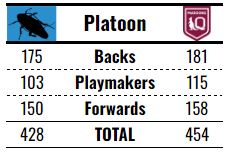
In total, the Maroons have a 26 Taylor advantage, which is good for about a 56% win percentage at this level of production (about four points in margin terms), but also have the edge in the three platoons2.
Still, the Maroons have historically struggled at neutral site venues, losing in Los Angeles, getting smashed on both trips to Perth and batting a bit under .500 in Melbourne (3-0 at Docklands, 1-4 at the MCG and 0-1 at Olympic Park). There’s only ever been a single Origin game in Adelaide. It was in 2020. The worst Queensland side of all time won 18-14 and the rest is extremely familiar history.
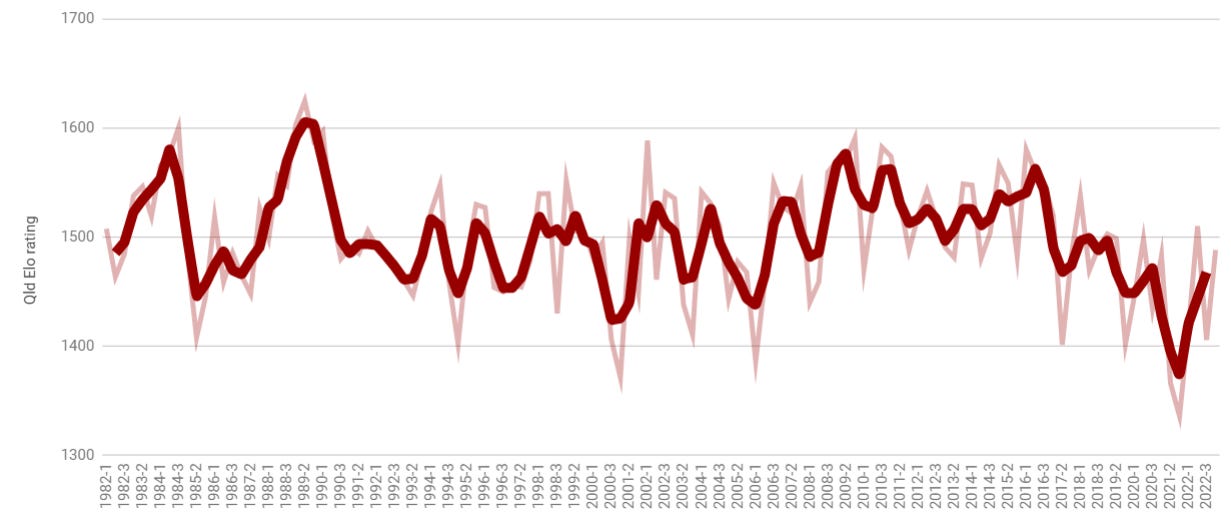
Queensland’s Elo rating - an extremely stupid thing to track in a two team series that has three games each year - is even pointing up.
It’s getting hard to find an underdog storyline. Someone’s going to have to get covid.
Trivia
The peak Origin Elo rating was after game 1 of the 1912 Interstate series, which New South Wales won 65-9 at the RAS Showgrounds in Sydney. This is somehow not the highest winning margin in Interstate history, which was 69-5 in game 3 of the 1957 series, played at the SCG. Queensland’s peak rating was after game 1 of the 1989 Origin series, which Queensland won 36-6 at Lang Park. The 1988 and 1989 series were back-to-back sweeps for the Maroons.
The narrative that people had lost interest in the Interstate Series, precipitating the switch from residential selections to State of Origin - itself derided as a gimmick that would never take off by the southern authorities, was driven primarily by Sydney’s lack of interest. Attendances at Interstate games in Brisbane in the 1970s averaged over 21,000, up on the 17,000 averaged through the 1960s and only bested by the 24,000 in the 1950s. Meanwhile, attendances in Sydney dropped from 34,000 in the 50s, to under 18,000 in the 60s and bottoming out under 11,000 in the 70s. While no one wants to go back to residential selection rules, not least because Queensland wins more than once a decade under Origin rules, it’s clear that New South Wales’ inability to get Origin has its genesis in the latter days of the Interstate Series.
Project Genetrix was an American intelligence program during the Cold War to release reconnaissance balloons over the Soviet Union. The program was largely a failure, producing just 31 useable images from 500 balloons, as the Russians used the balloons for target practice. However, the Soviets took the temperature-resistant and radiation-hardened film from the balloons recovered and used the film to take the first photos of the dark side of the moon in 1959.
NRL Stats Drop
Scroll to the end for the explanatory notes or visit How It All Works.
Queensland Cup Stats Drop
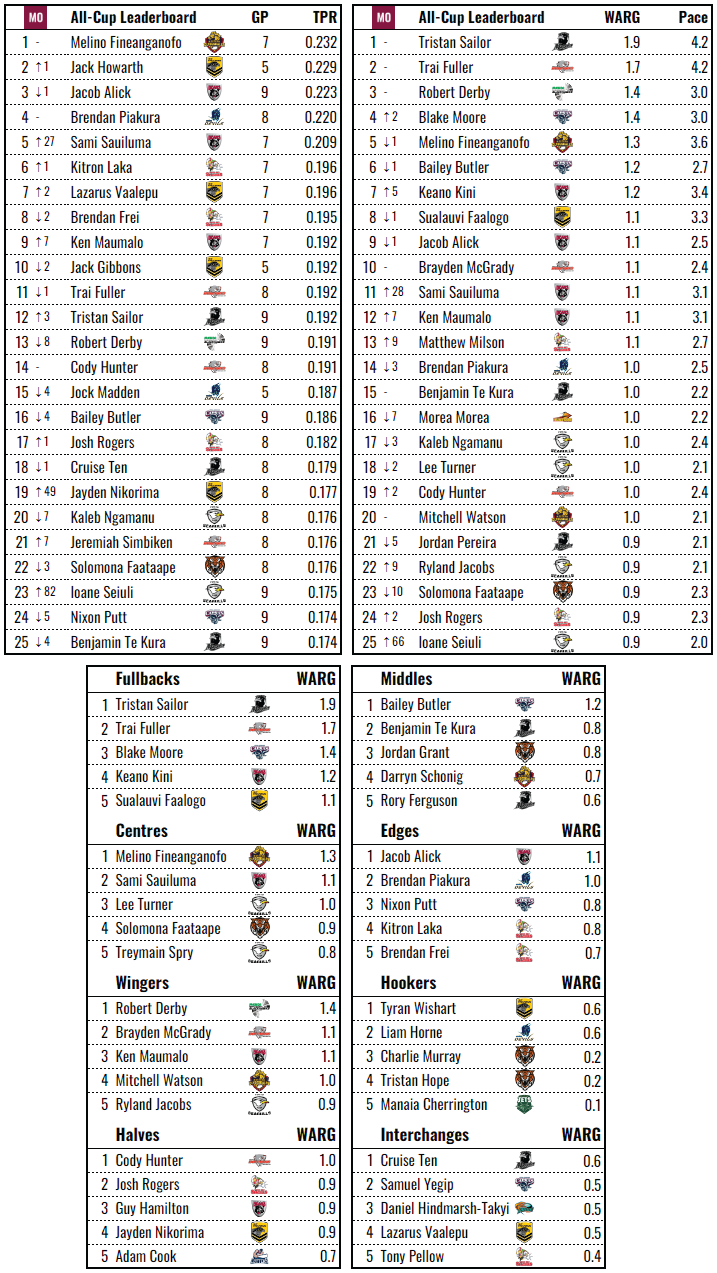
This is still in testing
Explanatory notes
Elo Ratings
Elo ratings are a way of quantitatively assessing teams, developing predictions for the outcomes of games and then re-rating teams based on their performance, home ground advantage and the strength of their opposition. Form Elo ratings are optimised for head-to-head tipping and tend to reflect the relative strengths of each team at that particular point in time, although there are many factors that affect a team’s rating.
Pythagorean Expectation and Winning Percentage Comparison
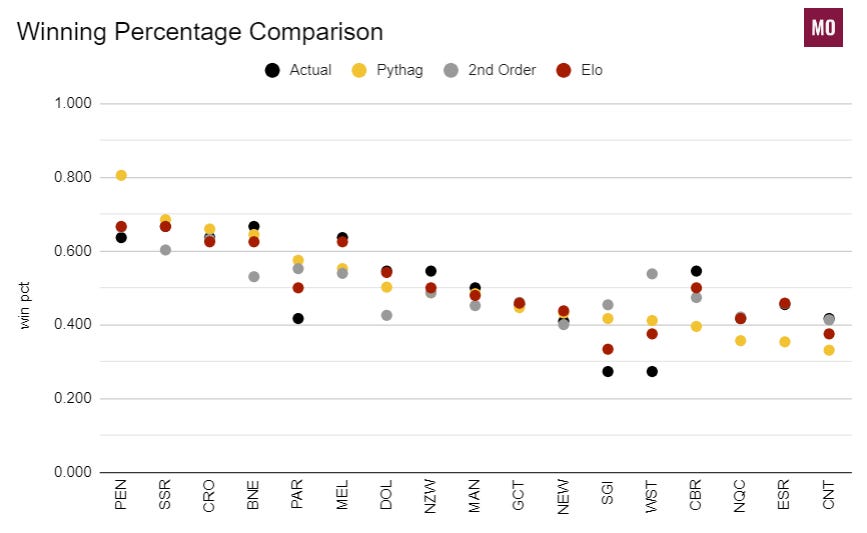
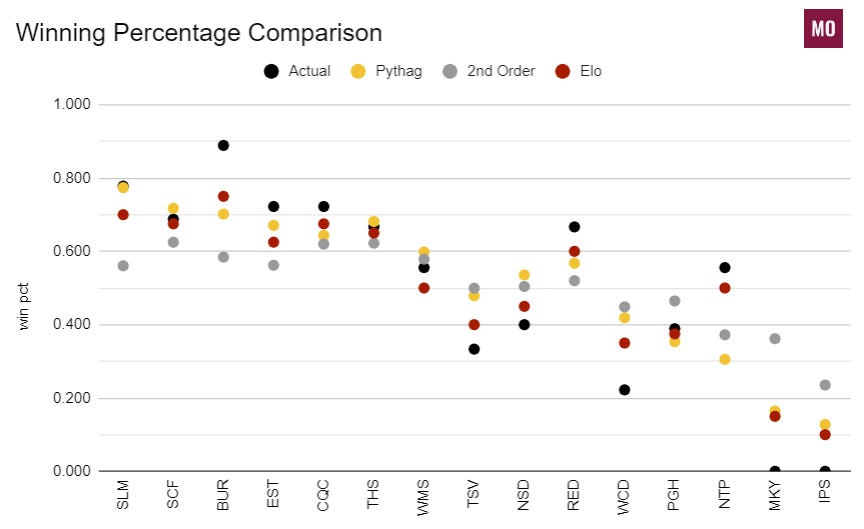
The black dots on the winning percentage comparison are each team’s actual win-loss record to this point in the season. The coloured dots represent what the stats say about the team’s underlying performance, i.e. how many games they should be winning. Wins and losses are binary and can be prone to good and bad luck in a way that other stats that correlate to wins are not, so we have other metrics to help see through the noise to good teams, rather than just good results. While each metric has strengths and weaknesses, it helps paint a more complete picture of team performance.
Pythagorean expectation (gold) relies on points scored and conceded by estimating a team’s number of wins based on their for and against. Where there is a deviation between a team’s actual record and their Pythagorean expectation, we can ascribe that to good fortune, when a team wins more than they are expected to, or bad fortune, when a team wins less than they are expected to. 2nd order wins (silver) relies on metres and breaks gained and conceded. Elo ratings (maroon) rely on the margin of victory and strength of opponent.
Dots should tend to gravitate towards each other. If a team’s dots are close together, that means their actual results are closely in line with their underlying metrics and represents a “true” or “fair” depiction of how good the team is. If a team’s coloured dots are clustered away from their actual record, then we should expect the actual and the coloured cluster to move towards each other over time.
If the black dot is well above gold, that team is suffering from good fortune and may mean regress to more typical luck in the future (vice versa also holds). The silver dots will tend to hover around .500, so if gold is between silver and .500, the team could have an efficiency issue. On the balance, I would expect more often the actual percentage will move towards the cluster but the opposite is also possible.
Player Leaderboards
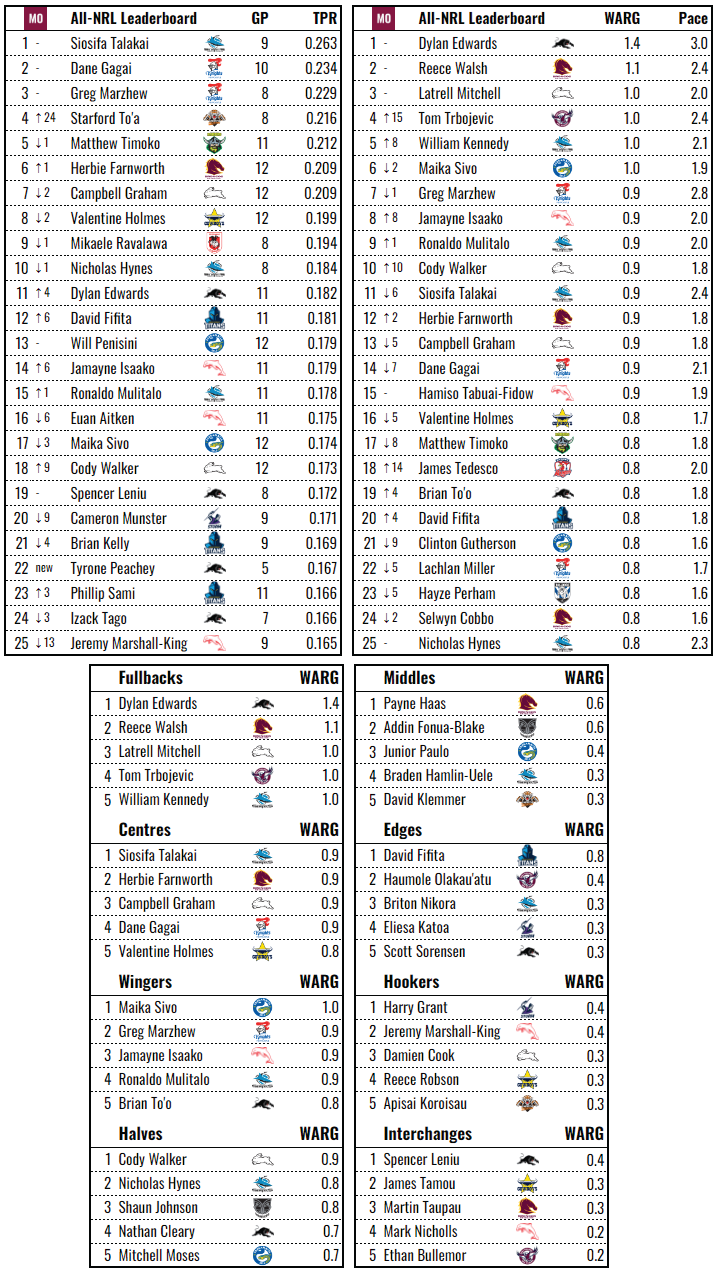
Production the amount of valuable work done by a team as measured in counting statistics that correlate with winning. These statistics are converted to a single unit called Taylors. Taylor Player Ratings (TPR) are a rate metric that compares an individual player’s production, time-adjusted, to that of the average player at their position, with a rating of .100 being average (minimum 5 games played). Wins Above Reserve Grade (WARG) is a volume metric that converts player’s production over a nominal replacement level into an equivalent number of wins they contribute to their team.
Team Strengths
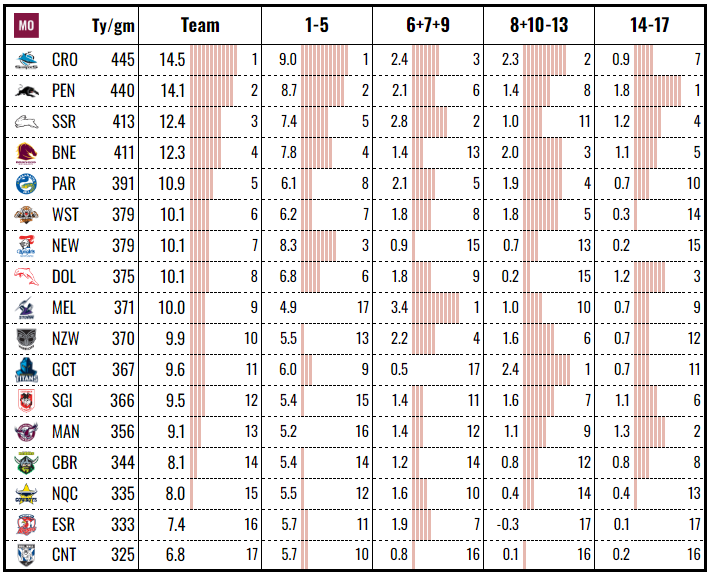
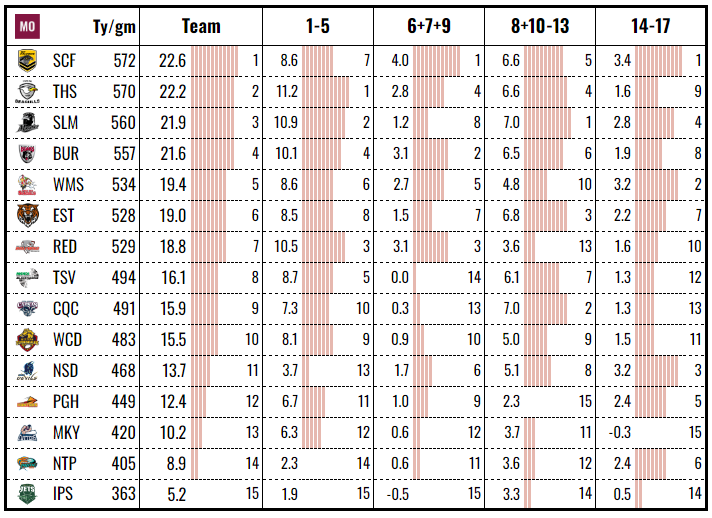
A chart that tabulates each team’s WARG, both as a team total and broken down into platoons by listed position, to identify each team’s relative strengths and weaknesses.
The WARG is the sum produced at the position, not by specific players, e.g. if Kalyn Ponga produces a total of 1.5 WARG comprising 1.0 WARG while named at fullback and 0.5 WARG named at five-eighth, then the WARG produced while named at fullback will be added to the 1-5 platoon and the WARG created while named in the halves will be added to the 6+7+9 platoon.
The top team in each category is rated 100, the bottom team is rated 0 and every team in between is scaled accordingly.
Team Efficiencies
This table compares the SCWP produced and conceded by each team (a product of their metres and breaks gained and conceded) against the actual points the team scores and concedes to measure which teams are most efficiently taking advantage of their opportunities. A lack of efficiency here could be the result of bad luck and poor execution - sometimes you have to watch the games.
Thanks for reading The Maroon Observer. If you haven’t already, you can subscribe below to receive all the latest about Queensland rugby league.
If you really enjoyed this, please forward the email on to someone who might also enjoy it.
Ironically, this is good for a Pythagorean expectation of 54% for the Blues. They just love to underperform on the sport’s biggest stage. Can’t get enough of it.
I deviated from my usual platoons to include Hynes and Grant in the playmaking platoons and then bundled the forwards and the remaining bench players together into a single group because neither coach is going to use a traditional rotation for their players.


