STATS DROP: Round 11, 2023
The captain's challenge, Jarrod Croker and Elliott Whitehead = not stupid, the first to 20 running km, the etymology of Rome, Form Elo, Pythagorean expectation, 2nd order wins, WARG and TPR
Welcome to Stats Drop, a weekly inundation of rugby league numbers.
The captain’s challenge was introduced into the NRL in 2020, an initiative the previous Greenberg administration. By and large, it’s been an interesting improvement to the game and something the administration has more or less gotten right out of the box.
The details are sometimes hard to fathom, but so are many of the intricacies of the NRL, and the challenge hasn’t been without its controversies. No one should forget the end of the Cowboys and Tigers game last year where North Queensland pulled off the most audacious heist in the history of the sport by challenging the very concept of full time1.
I’ve never seen any stats compiled on the use and successes of the captain’s challenge, which is strange when you think about it, but not hard to imagine why. I compiled the numbers for the season-to-date and it makes for interesting reading.
All four Queensland clubs are in the top six for success rate. The league leader, the Manly Sea Eagles, are succeeding two out of three times and are captained by the incumbent Maroons halfback. No one ever said Daly Cherry-Evans was dumb.
Obviously, there are issues using this analysis as a proxy for refereeing competence. It’s only 88 games, or at most 11 per referee, so a tiny sample size. An early unsuccessful challenge deprives the team of the ability to question any absolute howlers that come later in the game, although that seems to be largely the remit of the Bunker, which is blessed with papal infallibility2. Most of the unsuccessful challenges are time wasters in the last ten minutes of the game so the challenging team can catch their breath and reset their defence.
Even given all of the above caveats, I don’t think players should be overturning referees’ rulings at a rate of 57%. That goes double if you are the equal most challenged referee in the league. I haven’t checked the historical rates of challenge successes, which are probably much lower than what we’ve seen from this limited sample size, and referees can’t see everything and often have to make educated guesses about what they’re seeing due to the limitations of physics and the human mind, but that just can’t be right. A professional referee shouldn’t be outperformed by a coin toss, even within the subset of calls that captains tend to challenge.
Trivia
The Raiders challenge in roughly half their games, equal lowest in the league with the Dolphins, the Titans and the Dragons. With their five challenges, Canberra have been successful exactly zero times. To be clear, I’m not saying Jarrod Croker or Elliott Whitehead are stupid in case that makes them want to beat me up.
The Raiders are currently seventh on the ladder with a -29 points difference. In fourteenth, the Eels have a points difference of +24. In between them, in tenth, are the Roosters with a difference of -65. The Roosters have challenged in every single game this year.
For the third year running, the minor premier of the QRLW has not won the grand final. Souths Logan (7-0) didn’t even make it to the final this year, after the Capras (6-1) lost by two points last year and Valleys (7-0) by four the year before.
The Broncos need 281 metres before the Panthers get 655 to be the first NRL team to clock 20,000 running metres this season.
It has been traditionally held that the city of Rome was named for its legendary founder and first king, Romulus. Modern scholars believe that it was, in fact, the other way around: Rome, the city, was first named by its inhabitants and that Romulus, the legendary founder, was named after the city as part of the creation of that myth. Whether there was a real Romulus on which the legend was based, we’ll probably never know.
Form Elo Ratings
Elo ratings are a way of quantitatively assessing teams, developing predictions for the outcomes of games and then re-rating teams based on their performance, home ground advantage and the strength of their opposition. Form Elo ratings are optimised for head-to-head tipping and tend to reflect the relative strengths of each team at that particular point in time, although there are many factors that affect a team’s rating.
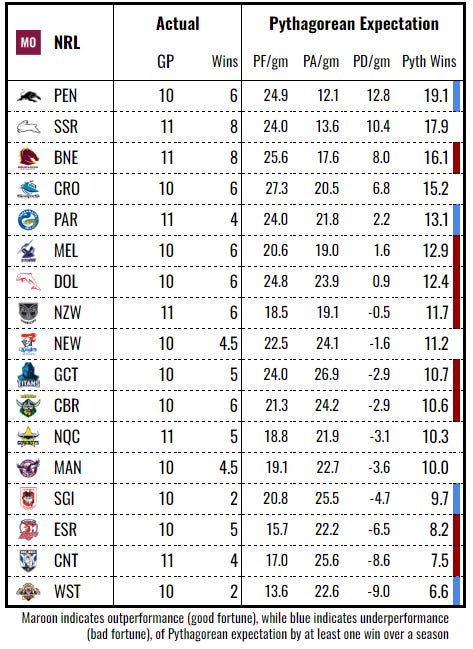
Pythagorean Expectation
Pythagorean expectation estimates a team’s number of wins based on their for and against with a reasonable degree of accuracy. Where there is a deviation between a team’s actual record and their Pythagorean expectation, we can ascribe that to good fortune, when a team wins more than they are expected to, or bad fortune, when a team wins less than they are expected to.
There’s always one or two teams each year that win more than their Pythagorean expectation and one or two that grossly underperform and it’s difficult to tell in advance which is which, but over the long run, Pythagoras remains undefeated and always demands his tribute.
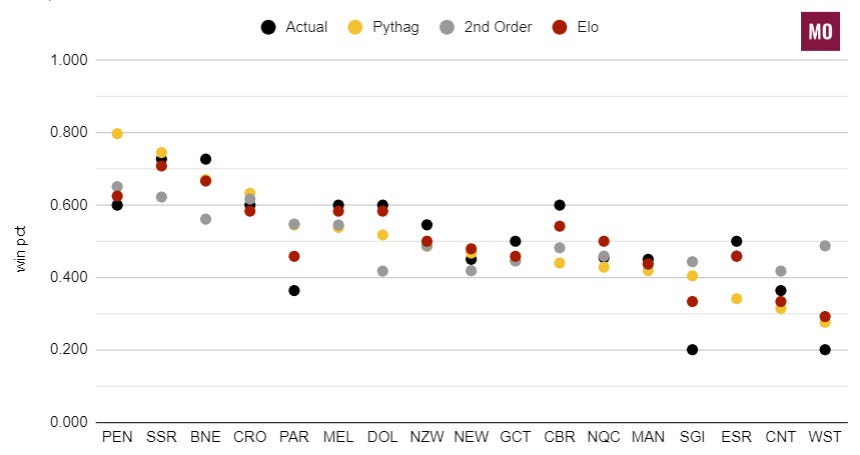
Win Percentage Comparison
The black dots are each team’s actual win-loss record to this point in the season. The coloured dots represent what the stats say about your team’s underlying performance, i.e. how many games they should be winning. Wins and losses are binary and can be prone to good and bad luck in a way that other stats that correlate to wins are not, so we have other metrics to help see through the noise to good teams, rather than just good results.
Pythagorean expectation (gold) relies on points scored and conceded. 2nd order wins (silver) relies on metres and breaks gained and conceded. Elo ratings (maroon) rely on the margin of victory and strength of opponent. Each metric has strengths and weaknesses.
Dots should tend to gravitate towards each other. If a team’s dots are close together, that means their actual results are closely in line with their underlying metrics and represents a “true” or “fair” depiction of how good the team is. If a team’s coloured dots are clustered away from their actual record, then we should expect the actual and the coloured cluster to move towards each other over time.
If the black dot is well above gold, that team is suffering from good fortune and may mean regress to more typical luck in the future (vice versa also holds). The silver dots will tend to hover around .500, so if gold is between silver and .500, the team could have an efficiency issue. On the balance, I would expect it’s more the actual moving towards the cluster but the opposite is also possible.
Team Efficiency
This table compares the SCWP produced and conceded by each team (a product their metres and breaks gained and conceded) against the actual points the team scores and concedes to measure which teams are most efficiently taking advantage of their opportunities. A lack of efficiency here could be the result of bad luck and poor execution - sometimes you have to watch the games.
Player Leaderboards
Production the amount of valuable work done by a team as measured in counting statistics that correlate with winning. These statistics are converted to a single unit called Taylors. Taylor Player Ratings (TPR) are a rate metric that compares an individual player’s production, time-adjusted, to that of the average player at their position, with a rating of .100 being average (minimum 5 games played). Wins Above Reserve Grade (WARG) is a volume metric that converts player’s production over a nominal replacement level into an equivalent number of wins they contribute to their team.
Queensland In Focus
Thanks for reading The Maroon Observer. If you haven’t already, you can subscribe below to receive all the latest about Queensland rugby league.
If you really enjoyed this, please forward the email on to someone who might also enjoy it.
This is obviously not exactly what happened and you’re more than welcome to take up any issues with my analysis by emailing graham.annesley@nrl.com.
Or at least until the higher powers of the Holy Trinity - the Judiciary, the Match Review Committee and V’Landys’ vibes (the father, son and holy ghost respectively) - get involved.


