
STATS DROP: Round 14, 2023
First class club football statistics, Form Elo, Pythagorean expectation, 2nd order wins, WARG and TPR for NRL and Queensland Cup

Welcome to Stats Drop, a weekly inundation of rugby league numbers.
It bugs me when a NRL commentator rattles off a piece of statistical trivia and says it’s the worst/best in the “history of the game”. The “game”, in this context and by extension the context used by most people, is the Sydney comp from 1908 to 1994, the short lived ARL from 1995 to 1997, the NRL from 1998 onwards and maybe Australian Super League if they’re feeling generous.
It is an incredibly dull view of the history of rugby league. It is a view that I believe is promulgated because of Australian rugby league’s inherent Sydney-centrism but also the relative availability of records or the Sydney comp. This continuity of record keeping gives the NSWRL a sheen of historical legitimacy, much in the same way that societies that build monuments out of stone traditionally have had more cultural cachet with historians than societies that build their monuments out of more perishable materials.
Ultimately, emphasising one aspect of the sport’s history while ignoring the rest because it is convenient, only serves to flatten and obscure huge swathes of rugby league history, to the detriment of everyone.
In Brisbane, the 1974 floods destroyed records stored in the low-lying QRL/BRL offices on Castlemaine Street. To my knowledge, no one has yet compiled a full list of BRL results, although the team at Rugby League Project (subscribe to their Patreon) are currently working on it1.
Without these records, it is not as easy to point to the history of the sport other parts of the world - whether it be Brisbane, Auckland or the bush - and it is unfairly given a lesser status as a result, which then makes it hard to put the career of someone like Eric Weissel - Hall of Famer, 18 years playing in the Riverina, never played for a Sydeny club but made eight appearances for Australia - into some sort of context.
I won’t proceed much further because I find it difficult to articulate the nature of the problem, why it matters and come up with anything approaching a rational solution. However, I’ve never been a fan of “first grade” as the moniker, which should denote the highest level of game played in a geographical area (e.g. first grade in Townsville and Sydney are different competitions in 1923 but in 2023, it’s just the NRL). My preference is to adopt the concept of “first class” matches from cricket - which has its own definitional problems - except that I think what constitutes first class is flexible and changes over time2.
I’ve made a start by compiling all of the ladders I could find for first division English rugby league (mostly from Wikipedia), the NSWRL (from RLP), the BRL (up to 1987, manually entered from Steve Haddan’s Our Game), the Super League and the NRL (both from RLP) into a single spreadsheet.3
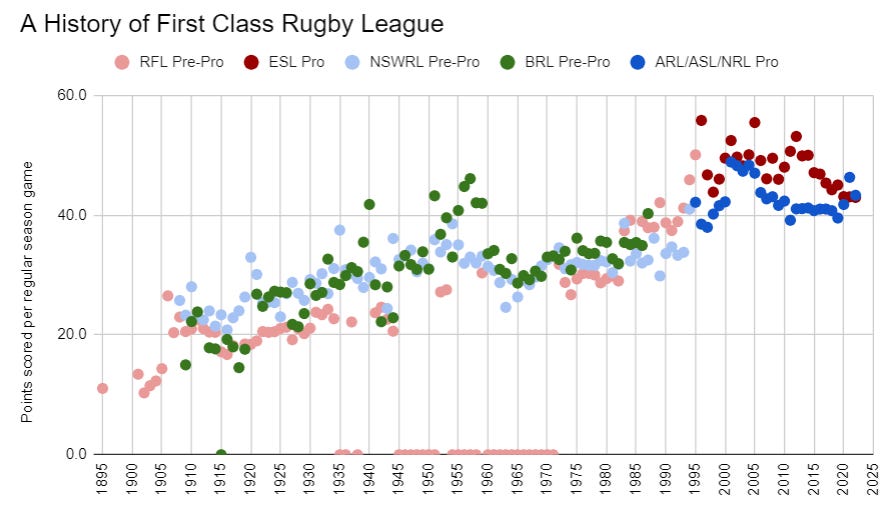
Over 1.4 million points were scored in the top flight Sydney and Brisbane comps and the national English and Australian leagues from 1895 to 20224 across 61,000-odd matches.
While it’s not complete without finals results, the data are good for providing some appropriate historical context to numbers. For example, 2023 Penrith’s current rate of conceding 11.9 points per game seems impressive and is a mark only bettered by three NRL-era teams5. But 1944 Western Suburbs (Brisbane) conceded 117 in 10 games (11.7) while finishing second last on that season’s BRL ladder. The ‘44 Mud and Bloods were 5.5 wins clear of cross-town rivals and last placed Eastern Suburbs, who managed to concede 25.8 points per game. In fact, over a quarter of historical teams conceded fewer points per game. It doesn’t seem so impressive if clubs of the calibre of Ebbw Vale and Natives and Merthyr can better it.
Trivia
In the 1940 BRL premiership, the Eastern Suburbs District Rugby League Football Club conceded 509 points in ten games for what was the worst defensive performance of any club known in first class rugby league. The next worst team, 1906/07 Liverpool City, conceded four points fewer per game at 46.6. 1898/88 St Helens conceded just 18 points in 26 games (0.7 points per game).
The most points scored per game was St Helens in 1996 at 43.2. The 1917/18 Rochdale Hornets managed to score 1.0 points per game in a 7 game, and winless, season. Liversedge in 1900/01 had the worst non-wartime record of 43 points scored in 30 games (1.4 points per game).
Valleys, including Valleys-Toombul, won 21 premierships between 1909 and 1987. Souths, Wests and Wynnum-Manly received 13 wooden spoons each (excluding their progenitor clubs).
After 13 games, the ‘23 Dolphins are 7-6 (-7). The ‘88 Broncos were 9-4 (+71), the ‘95 Cowboys were 1-12 (-230) and the ‘07 Titans were 7-6 (+1).
NRL Stats Drop
Scroll to the end for the explanatory notes or visit How It All Works.


Queensland Cup Stats Drop


Explanatory notes
Elo Ratings
Elo ratings are a way of quantitatively assessing teams, developing predictions for the outcomes of games and then re-rating teams based on their performance, home ground advantage and the strength of their opposition. Form Elo ratings are optimised for head-to-head tipping and tend to reflect the relative strengths of each team at that particular point in time, although there are many factors that affect a team’s rating.
Pythagorean Expectation and Winning Percentage Comparison
The black dots on the winning percentage comparison are each team’s actual win-loss record to this point in the season. The coloured dots represent what the stats say about the team’s underlying performance, i.e. how many games they should be winning. Wins and losses are binary and can be prone to good and bad luck in a way that other stats that correlate to wins are not, so we have other metrics to help see through the noise to good teams, rather than just good results. While each metric has strengths and weaknesses, it helps paint a more complete picture of team performance.
Pythagorean expectation (gold) relies on points scored and conceded by estimating a team’s number of wins based on their for and against. Where there is a deviation between a team’s actual record and their Pythagorean expectation, we can ascribe that to good fortune, when a team wins more than they are expected to, or bad fortune, when a team wins less than they are expected to. 2nd order wins (silver) relies on metres and breaks gained and conceded. Elo ratings (maroon) rely on the margin of victory and strength of opponent.
Dots should tend to gravitate towards each other. If a team’s dots are close together, that means their actual results are closely in line with their underlying metrics and represents a “true” or “fair” depiction of how good the team is. If a team’s coloured dots are clustered away from their actual record, then we should expect the actual and the coloured cluster to move towards each other over time.
If the black dot is well above gold, that team is suffering from good fortune and may mean regress to more typical luck in the future (vice versa also holds). The silver dots will tend to hover around .500, so if gold is between silver and .500, the team could have an efficiency issue. On the balance, I would expect more often the actual percentage will move towards the cluster but the opposite is also possible.
Player Leaderboards
Production the amount of valuable work done by a team as measured in counting statistics that correlate with winning. These statistics are converted to a single unit called Taylors. Taylor Player Ratings (TPR) are a rate metric that compares an individual player’s production, time-adjusted, to that of the average player at their position, with a rating of .100 being average (minimum 5 games played). Wins Above Reserve Grade (WARG) is a volume metric that converts player’s production over a nominal replacement level into an equivalent number of wins they contribute to their team.
Team Strengths
A chart that tabulates each team’s WARG, both as a team total and broken down into platoons by listed position, to identify each team’s relative strengths and weaknesses.
The WARG is the sum produced at the position, not by specific players, e.g. if Kalyn Ponga produces a total of 1.5 WARG comprising 1.0 WARG while named at fullback and 0.5 WARG named at five-eighth, then the WARG produced while named at fullback will be added to the 1-5 platoon and the WARG created while named in the halves will be added to the 6+7+9 platoon.
The top team in each category is rated 100, the bottom team is rated 0 and every team in between is scaled accordingly.
Team Efficiencies
This table compares the SCWP produced and conceded by each team (a product of their metres and breaks gained and conceded) against the actual points the team scores and concedes to measure which teams are most efficiently taking advantage of their opportunities. A lack of efficiency here could be the result of bad luck and poor execution - sometimes you have to watch the games.
Thanks for reading The Maroon Observer. If you haven’t already, you can subscribe below to receive all the latest about Queensland rugby league.
If you really enjoyed this, please forward the email on to someone who might also enjoy it.
I’ve got a full list of Queensland Cup results with no details or lineups that would allow for deeper analysis but someone at the QRL must be keeping records because they know who the top points scorers, top try scorers, etc are. Sharing that information with the RLP team would probably save them a lot of time!
A working definition might be “a first grade (using the definition above) competition from which players are routinely selected for Australia, New Zealand and England“, which is a pretty good first order approximation for where I want to go but it doesn’t take a genius to see the flaws there.
I think I mostly want to dispense with the idea that St George’s 11 in a row was a world record for most consecutive national sporting titles won - they never played anyone outside of their own city! I am once again calling on the Dolphins to hold the name Redcliffe hostage until the NRL recognises their 1965 premiership as equivalent to the NSWRL ones.
Ideally, we’d also have the stretch that France was a power in the international game (circa 1930s to 1960s), pre-war district footy in Australia, some (?) Auckland rugby league and all pre-split English rugby and pre-All Golds Australian rugby.
Whether you think that pre-war premierships are in any way equivalent to modern titles is an exercise that I will leave to the reader.
Noting that we do not have for and against for 777 of 4,686 records, about 17% of the total, mostly in England. These are the dots anchored to the bottom of the chart.
07 Storm, 08 Storm, 20 Panthers. 21 Panthers as well, depending on your tolerance for rounding.