STATS DROP: Round 6, 2023
Dolphins' NRL attendance boost, James Tedesco, Beau Falloon, Danny Levi, quarks, form Elo, Pythagorean expectation, team efficiency, WARG and TPR leaderboards and Broncos in focus
Welcome to Stats Drop, a weekly inundation of rugby league numbers.
The record attendance for a NRL season was an average of 16,468 per game in 2005, according to Rugby League Tables1. So far, 2023 is running at an average of 19,410 per game, according to Rugby League Project, which is 20% up on 2022’s completed season average. There's a mix of probable causes for this increase: the lead-in from the World Cup and a semi-polished Pre-Season Challenge™, the apparent evenness of the competition after years of Vlandoball, prevailing economic conditions2 and the introduction of the Dolphins.
To see what impact the novelty of the Dolphins are having, I tabulated the average home or away attendance over the last five real seasons (2016 to 2019 and 2022 using RLP data) for each of the opponents the Dolphins have so far played to compare against the actual attendances recorded. For example, when the Dolphins hosted the Roosters, I replaced that real attendance with the averaged Roosters’ away attendance over that period to estimate roughly how many more people have come to games over what we would expect if the Dolphins were not in the competition.3
The result is that crowds would be about 5% lower, or around 44,000 fewer people in aggregate, without the Dolphins. It would still be a fantastic start to the year either way, but not quite as remarkable without the NRL’s newest team.
Trivia
James Tedesco is the career NRL leader in Wins Above Reserve Grade (WARG). From 2013, when stats become available, to round 6 of 2023, Tedesco has accumulated 14.6 WARG over 197 games of the regular season. He's ahead of Daly Cherry-Evans (12.5 over 222 games), Jason Taumalolo (12.4 over 204), Roger Tuivasa-Scheck (10.5 over 180) and Shaun Johnon (10.4 over 193).
The player with the most games played with a total WARG of 0 +/- 0.05 is Beau Falloon, with 52 games played for the Titans between 2013 and 2015. This honour used to be held by Danny Levi, but his time at Brisbane and Canberra have seen him amass over 0.1 WARG.
Prior to 1897, it was thought that the indivisible unit of matter was the atom. Thanks to advances in physics through the 20th century, not only do we know the atom consists of a nucleus - an amalgamation of protons and neutrons held together by the strong nuclear force - and electrons, we also know the proton and neutron themselves are made up of even smaller particles called quarks, which come in a dizzying array of colours, flavours, spins and part-unit charges.4
Form Elo Ratings
Elo ratings are a way of quantitatively assessing teams, developing predictions for the outcomes of games and then re-rating teams based on their performance, home ground advantage and the strength of their opposition. Form Elo ratings are optimised for head-to-head tipping and tend to reflect the relative strengths of each team at that particular point in time, although there are many factors that affect a team’s rating.
Pythagorean Expectation
Pythagorean expectation estimates a team’s number of wins based on their for and against with a reasonable degree of accuracy. Where there is a deviation between a team’s actual record and their Pythagorean expectation, we can ascribe that to good fortune, when a team wins more than they are expected to, or bad fortune, when a team wins less than they are expected to.
There’s always one or two teams each year that win more than their Pythagorean expectation and one or two that grossly underperform and it’s difficult to tell in advance which is which, but over the long run, Pythagoras remains undefeated and always demands his tribute.
Win Percentage Comparison
The black dots are each team’s actual win-loss record to this point in the season. The coloured dots represent what the stats say about your team’s underlying performance, i.e. how many games they should be winning. Wins and losses are binary and can be prone to good and bad luck in a way that other stats that correlate to wins are not, so we have other metrics to help see through the noise to good teams, rather than just good results.
Pythagorean expectation (gold) relies on points scored and conceded. 2nd order wins (silver) relies on metres and breaks gained and conceded. Elo ratings (maroon) rely on the margin of victory and strength of opponent. Each metric has strengths and weaknesses.
Dots should tend to gravitate towards each other. If a team’s dots are close together, that means their actual results are closely in line with their underlying metrics and represents a “true” or “fair” depiction of how good the team is. If a team’s coloured dots are clustered away from their actual record, then we should expect the actual to move towards the cluster over time.
If the black dot is well above gold, that team is suffering from good fortune and may mean regress to more typical luck in the future (vice versa also holds). The silver dots will tend to hover around .500, so if gold is between silver and .500, the team could have an efficiency issue.
Team Efficiency
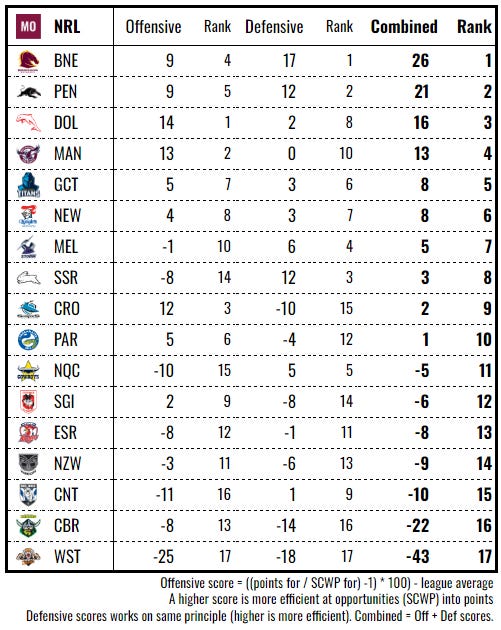
This table compares the SCWP produced and conceded by each team (a product their metres and breaks gained and conceded) against the actual points the team scores and concedes to measure which teams are most efficiently taking advantage of their opportunities.
Player Leaderboards
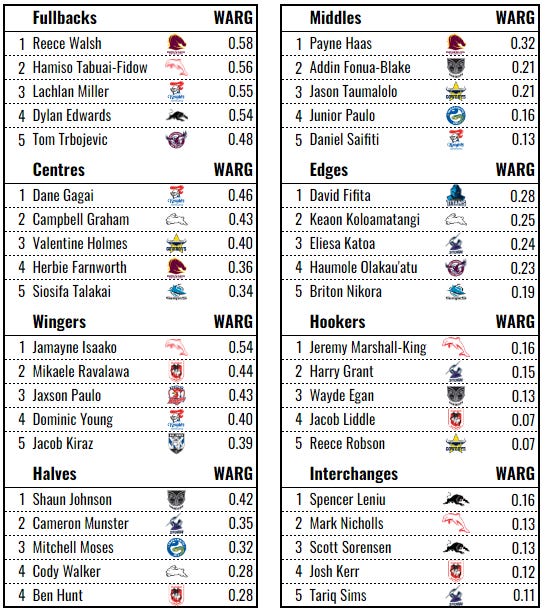
Production the amount of valuable work done by a team as measured in counting statistics that correlate with winning. These statistics are converted to a single unit called Taylors. Taylor Player Ratings (TPR) are a rate metric that compares an individual player’s production, time-adjusted, to that of the average player at their position, with a rating of .100 being average (minimum 5 games played). Wins Above Reserve Grade (WARG) is a volume metric that converts player’s production over a nominal replacement level into an equivalent number of wins they contribute to their team.
In Focus: Broncos
(I plan to rotate through the Queensland clubs in this section, so you will get a roughly monthly update on these extremely detailed stats. Unfortunately, I can only jam in so many tables before Substack cuts me off.)
Thanks for reading The Maroon Observer. If you haven’t already, you can subscribe below to receive all the latest about Queensland rugby league.
If you really enjoyed this, please share it or forward it on to someone who might also enjoy it.
The best pre-Broncos/Giants season was 1968 at just 12,854, which is 26th in the Sydney comp+NRL history (1957 to present).
The AFL is also having a bountiful attendance harvest.
This was the more conservative of the two methods I compared. I also substituted in the bye team’s average crowds for Dolphins home games. This method estimates a Dolphins boost of 7-8%.
Note that I used the Broncos home attendance for round 4, rather than away, because it was played at Suncorp and the Broncos’ away attendance did not seem applicable.
Finally, using averages when we’re at one end of the distribution curve is crude but even factoring a nominal addition percentage for whatever other conditions in 2023 that conducive to going to games, doesn’t especially affect the outcome.
Colour, flavour, spin and charge are all metaphors used by particle physicists to convey the majesty of the universe in a format that's comprehensible by the inadequate human mind.


