STATS DROP: Magic Round, 2023
Magic Round attendances and stats, the legality of weed in the US, Form Elo, Pythagorean expectation, 2nd order wins, WARG and TPR
Welcome to Stats Drop, a weekly inundation of rugby league numbers.
The Brisbane NRL double-header began in 2016 when the Queensland government bought and brought Manly’s home game against the Broncos to Suncorp. It was paired with a curtain raiser between the Storm and the Cowboys on the Saturday of round 10. The game sold out three days in advance with an official crowd of 52,347 for both games.
The next year, the Cowboys were swapped out for the Titans, who won that shoot-out with the Storm, 38-36, and the Broncos accounted for Manly, 24-14, in front of 44,127. In 2018, the same line-up attracted only 31,118 with the results for both games flipped, Melbourne winning 28-14 and Manly trumping Brisbane, 38-24.
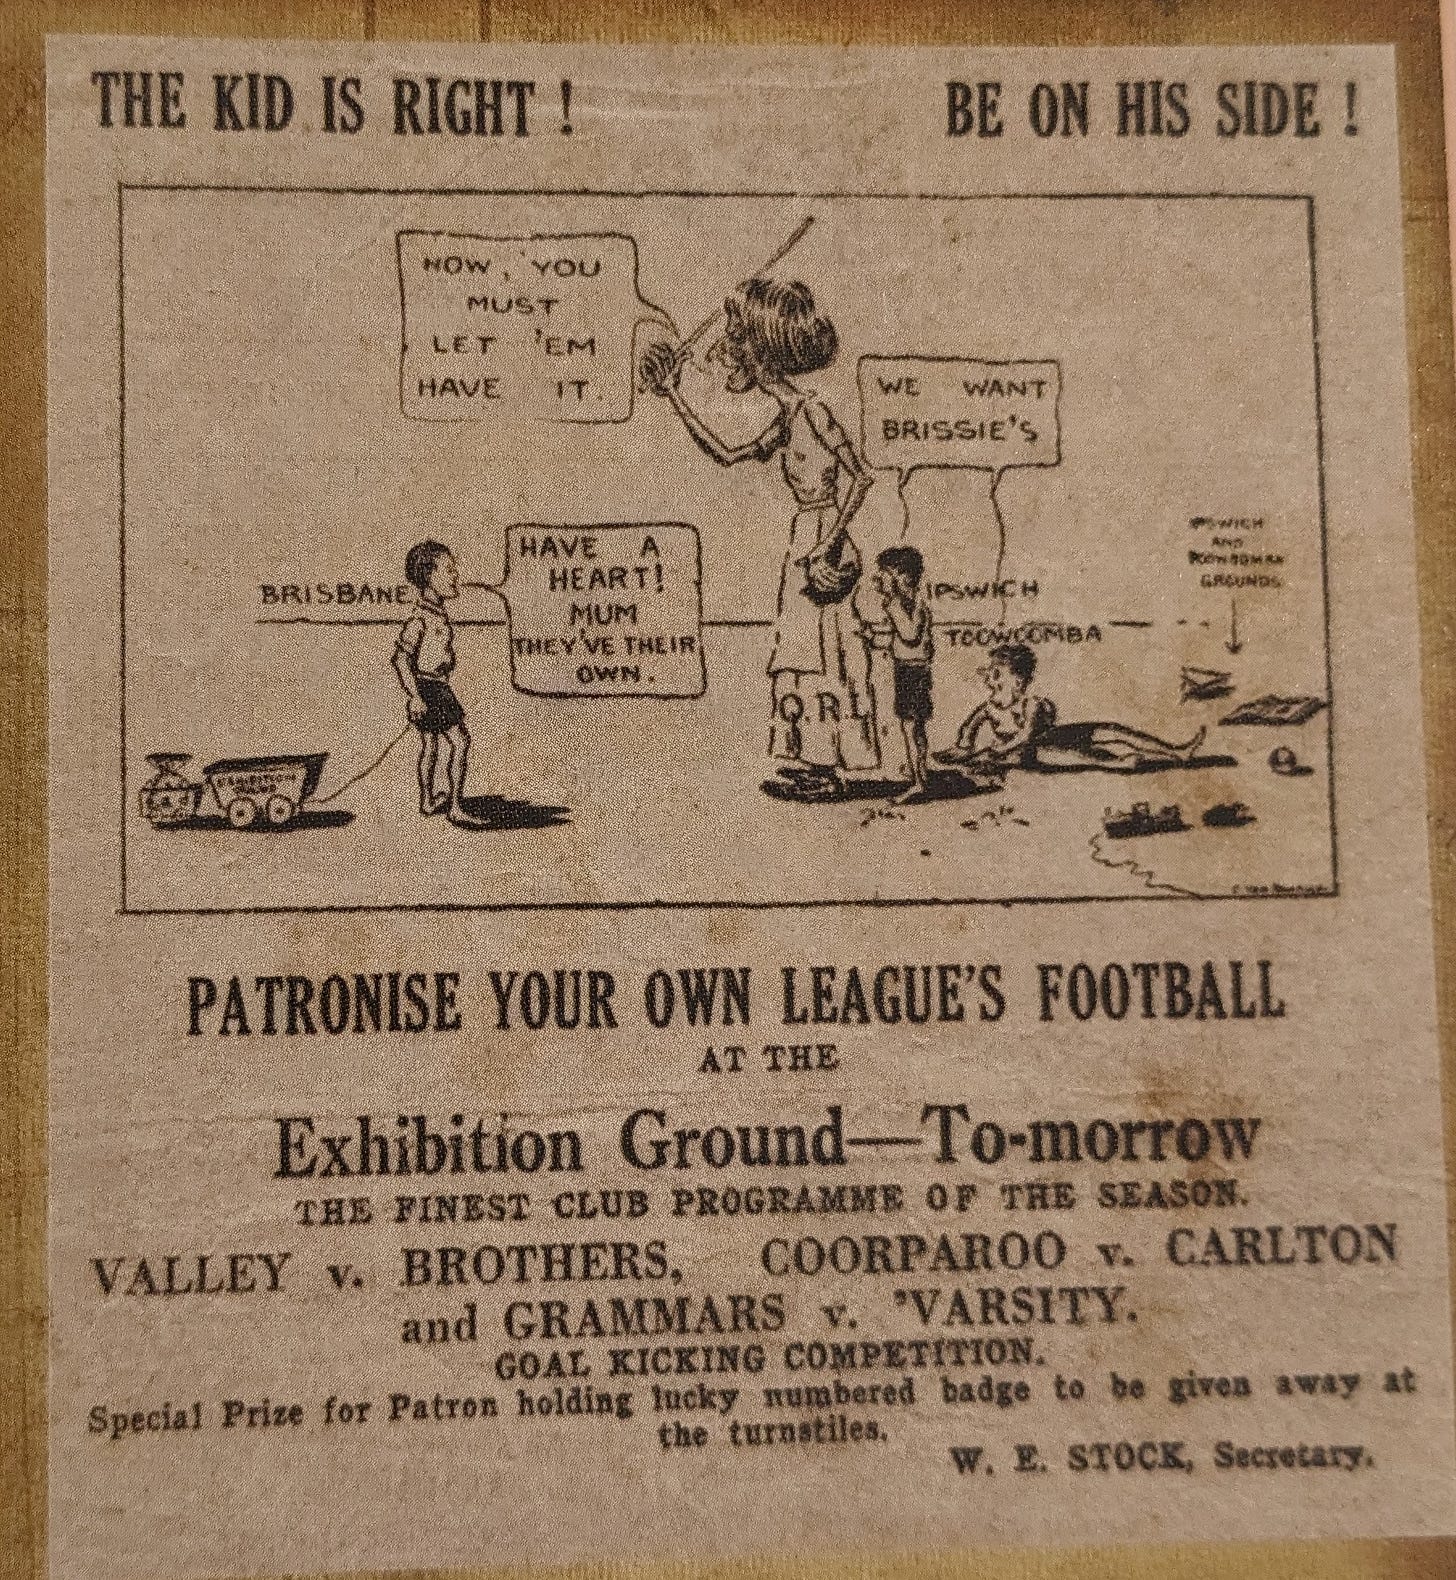
In 2019, the double-header expanded and Magic Round was introduced. While it was a rip-off of the English’s Magic Weekend, playing all games in one weekend at one venue was not unheard of in Australia. Sydney’s Leagueathon in 1977 and 1978 attracted five-figure crowds to the SCG for what sounds like an unbearably terrible time and entirely typical for that city. In Brisbane, the very first Magic Round might have been this from 19241, in which the QRL, who were not on friendly terms with the BRL at the time, decided to schedule intercity trials for the interstate series, to deliberately clash with the city club matches, hence the cartoon2.
Since 2019, the popularity of Magic Round has increased year-on-year. Here are the reported attendances.
The NRL has worked out their optimal arrangements, with the same teams selling their home games from 2021 through 2023, albeit with differing opponents, with the only change from 2019 is that Cronulla has taken over from Souths. The growth is immediately apparent. The first year peaked at 41,612 to watch the Eels get pantsed by the Storm. Five of the games in 2023 topped that mark and Storm vs Souths came close to matching Conflict on Caxton.
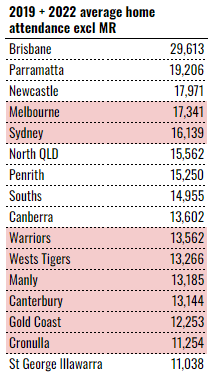
It’s telling that these clubs never complain about moving home games for Magic Round, which makes it clear that the state government makes it lucrative for them to do so3. Looking at those club’s attendances with Magic Round removed, it’s not hard to see why they’re so cooperative. Here’s the average attendance for each NRL club for the 2019 and 2022 seasons (i.e. the pandemic years removed), with Magic Round taken out (2021-23 MR hosts highlighted).
Summing up the max attendance each day4 and deducting the hosts' usual attendances from the table above gives an extra 20,000 tickets sold than if these were the home teams in a normal round, accelerating massively to 37,000 this year. In reality, it's more like one to two hundred thousand additional bums in seats.5
The Dolphins are driving attendances in 2023 but the Magic Round concept is probably the only other source of growth in NRL attendances.
Unlike the English version, which thrives on scheduling big derbies as a lure to get fans to Newcastle or Liverpool, the Australian version is a dumping ground for the NRL’s least wanted inventory. Each day is anchored by a Queensland team, provided your definition of Queensland includes Victoria. The Storm were the Queensland team on the Saturday in the inaugural Magic Round and have traditionally owned the Saturday night slot. With the introduction of the Dolphins, the NRL can have the Broncos headline Friday, the Dolphins and Storm on Saturday and the Cowboys and Titans to round out the weekend, ensuring a decent level of local interest to buttress the tourists from down south.
And it’s working. Saturday sold out in 2022. All three days of 2023 sold out and the numbers reflect that. Next year, it will become a challenge to get any tickets at all.
Trivia
“Moderately interesting stat: No team has ever lost at Magic Round and gone on to win the Premiership.” Clearly posted before the Eels lost to the Titans but that leaves the Queensland four, Penrith, Souths, Canberra and Wests Tigers left in the hunt, although the Raiders (and, incredibly, not the Tigers) drubbing at the hands of the Panthers falls foul of a different premiership “rule”.
The last full round of the NRL to be held entirely in NSW was round 21 of 2018. With six games in Sydney, one in Newcastle and one in Wollongong, it attracted a grand total of 96,118 patrons. You can draw your own conclusions about the viability of a NSW-hosted Magic Round. For the record, the NRL listed the weather as good for all matches.
The structure of legalised marijuana markets in the US vary greatly from state-to-state. Weed remains a schedule I drug - whereas cocaine, meth, fentanyl and oxycodone are schedule II - and is illegal under federal law. In the 22 states where it is “legal”, everyone seems to have agreed to look the other way. Those states have been left to develop their own regulations and redress their own historical social injustices, which are creating their own problems.
Form Elo Ratings
Elo ratings are a way of quantitatively assessing teams, developing predictions for the outcomes of games and then re-rating teams based on their performance, home ground advantage and the strength of their opposition. Form Elo ratings are optimised for head-to-head tipping and tend to reflect the relative strengths of each team at that particular point in time, although there are many factors that affect a team’s rating.
Pythagorean Expectation
Pythagorean expectation estimates a team’s number of wins based on their for and against with a reasonable degree of accuracy. Where there is a deviation between a team’s actual record and their Pythagorean expectation, we can ascribe that to good fortune, when a team wins more than they are expected to, or bad fortune, when a team wins less than they are expected to.
There’s always one or two teams each year that win more than their Pythagorean expectation and one or two that grossly underperform and it’s difficult to tell in advance which is which, but over the long run, Pythagoras remains undefeated and always demands his tribute.
Win Percentage Comparison
The black dots are each team’s actual win-loss record to this point in the season. The coloured dots represent what the stats say about your team’s underlying performance, i.e. how many games they should be winning. Wins and losses are binary and can be prone to good and bad luck in a way that other stats that correlate to wins are not, so we have other metrics to help see through the noise to good teams, rather than just good results.
Pythagorean expectation (gold) relies on points scored and conceded. 2nd order wins (silver) relies on metres and breaks gained and conceded. Elo ratings (maroon) rely on the margin of victory and strength of opponent. Each metric has strengths and weaknesses.
Dots should tend to gravitate towards each other. If a team’s dots are close together, that means their actual results are closely in line with their underlying metrics and represents a “true” or “fair” depiction of how good the team is. If a team’s coloured dots are clustered away from their actual record, then we should expect the actual and the coloured cluster to move towards each other over time.
If the black dot is well above gold, that team is suffering from good fortune and may mean regress to more typical luck in the future (vice versa also holds). The silver dots will tend to hover around .500, so if gold is between silver and .500, the team could have an efficiency issue. On the balance, I would expect it’s more the actual moving towards the cluster but the opposite is also possible.
Team Efficiency
This table compares the SCWP produced and conceded by each team (a product their metres and breaks gained and conceded) against the actual points the team scores and concedes to measure which teams are most efficiently taking advantage of their opportunities. A lack of efficiency here could be the result of bad luck and poor execution - sometimes you have to watch the games.
Player Leaderboards
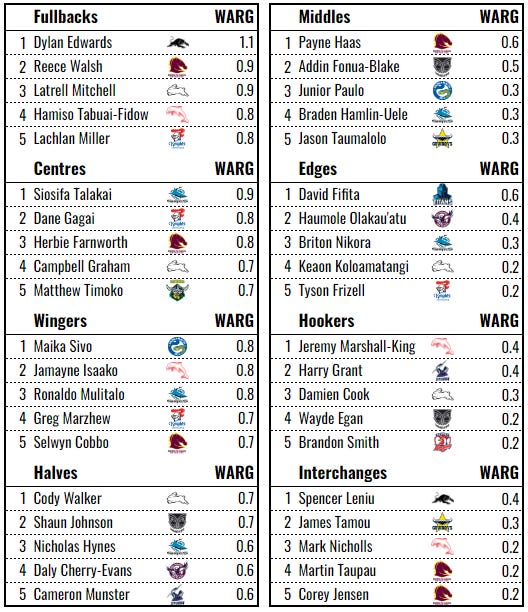
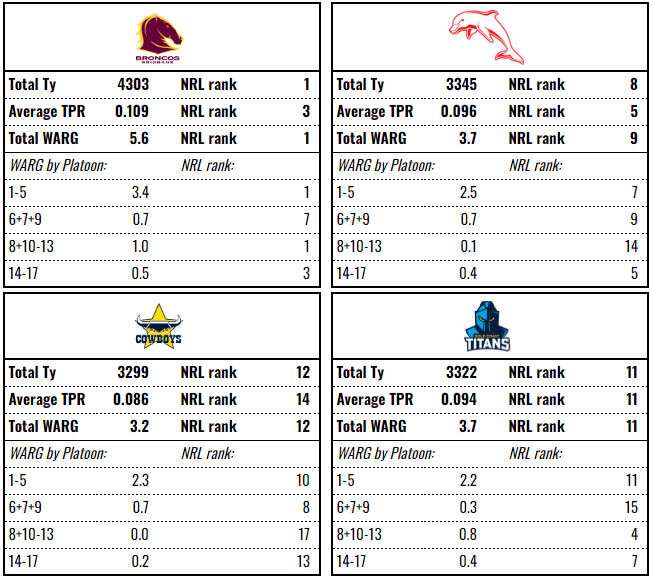
Production the amount of valuable work done by a team as measured in counting statistics that correlate with winning. These statistics are converted to a single unit called Taylors. Taylor Player Ratings (TPR) are a rate metric that compares an individual player’s production, time-adjusted, to that of the average player at their position, with a rating of .100 being average (minimum 5 games played). Wins Above Reserve Grade (WARG) is a volume metric that converts player’s production over a nominal replacement level into an equivalent number of wins they contribute to their team.
Queensland In Focus
No Queensland player data this week because the comic took up that space. I’m going to retool the listing anyway, so it’s a little less tedious to compile and a little more useful to look at.
Thanks for reading The Maroon Observer. If you haven’t already, you can subscribe below to receive all the latest about Queensland rugby league.
If you really enjoyed this, please share it or forward it on to someone who might also enjoy it.
I suspect this was actually pretty common in the old days but can’t find the evidence I was looking for of it.
I don’t get it. Also, Wests had the bye.
The state government would be getting somewhere between a half and a million dollars a day back in stadium rentals, based on the Broncos’ costs, so that helps ease the burden.
Which people will try to argue is the “true” attendance but this is bullshit. If I buy a single ticket and sit through eight games, I attended eight games. If I buy a single membership and sit through 12 games, I attended 12 games. If I buy eight tickets and sit through eight games, I attended eight games. The number of tickets sold or the “events” held or the location of the game is irrelevant and all that matters is counting bums on seats. That’s what attendance is.
If Sydney clubs can attract 4x the attendance in Brisbane than Sydney (or 2x in Adelaide), then there’s probably an argument to be made as to whether the NRL would be better off re-allocating those licences to other organisations.
Some might point out that these figures are very optimistic, which is obviously true. The numbers reflect something like the peak attendance during the match, as the pattern seems to be that the crowd will filter in during the first game, continue building through the second and start filtering out once the final game of the day is more or less decided, accelerating the drain after half time as people rush off to Honey Bs or whatever. 46k weren’t there at the end of Titans vs Eels but they might have been technically in the stadium at kick-off. I’m choosing to treat this as a systematic error (except for the Dogs game in 2019, which bugs me that it was officially recorded as 12k for reasons I can no longer remember), as everyone overinflates their figures by the same degree, so it cancels out in the comparison, even if the numbers are unreliable to determine how many people actually watched the game. See also: TV ratings, any survey, election results in heavily fruit-based economies.


